Opendata-maps, a map visualization tool for the people
Today I have released the source code of my maps visualization tool. I've been working on this project for the last three months. This is the result of experimenting with open data and researching new ways to share information with the people.
I just published the code of my #maps visualization tool. #opendata #smartcities #BigData @laravelphp @Mapbox https://t.co/JVuGSj5lAy
— Jaume Sala (@jaumesala84) May 13, 2016
This idea came from the experience I had during my time in the city of Shiedam in The Netherlands, as part of the practical work of the Masters Degree in Smart Cities that I started last September.
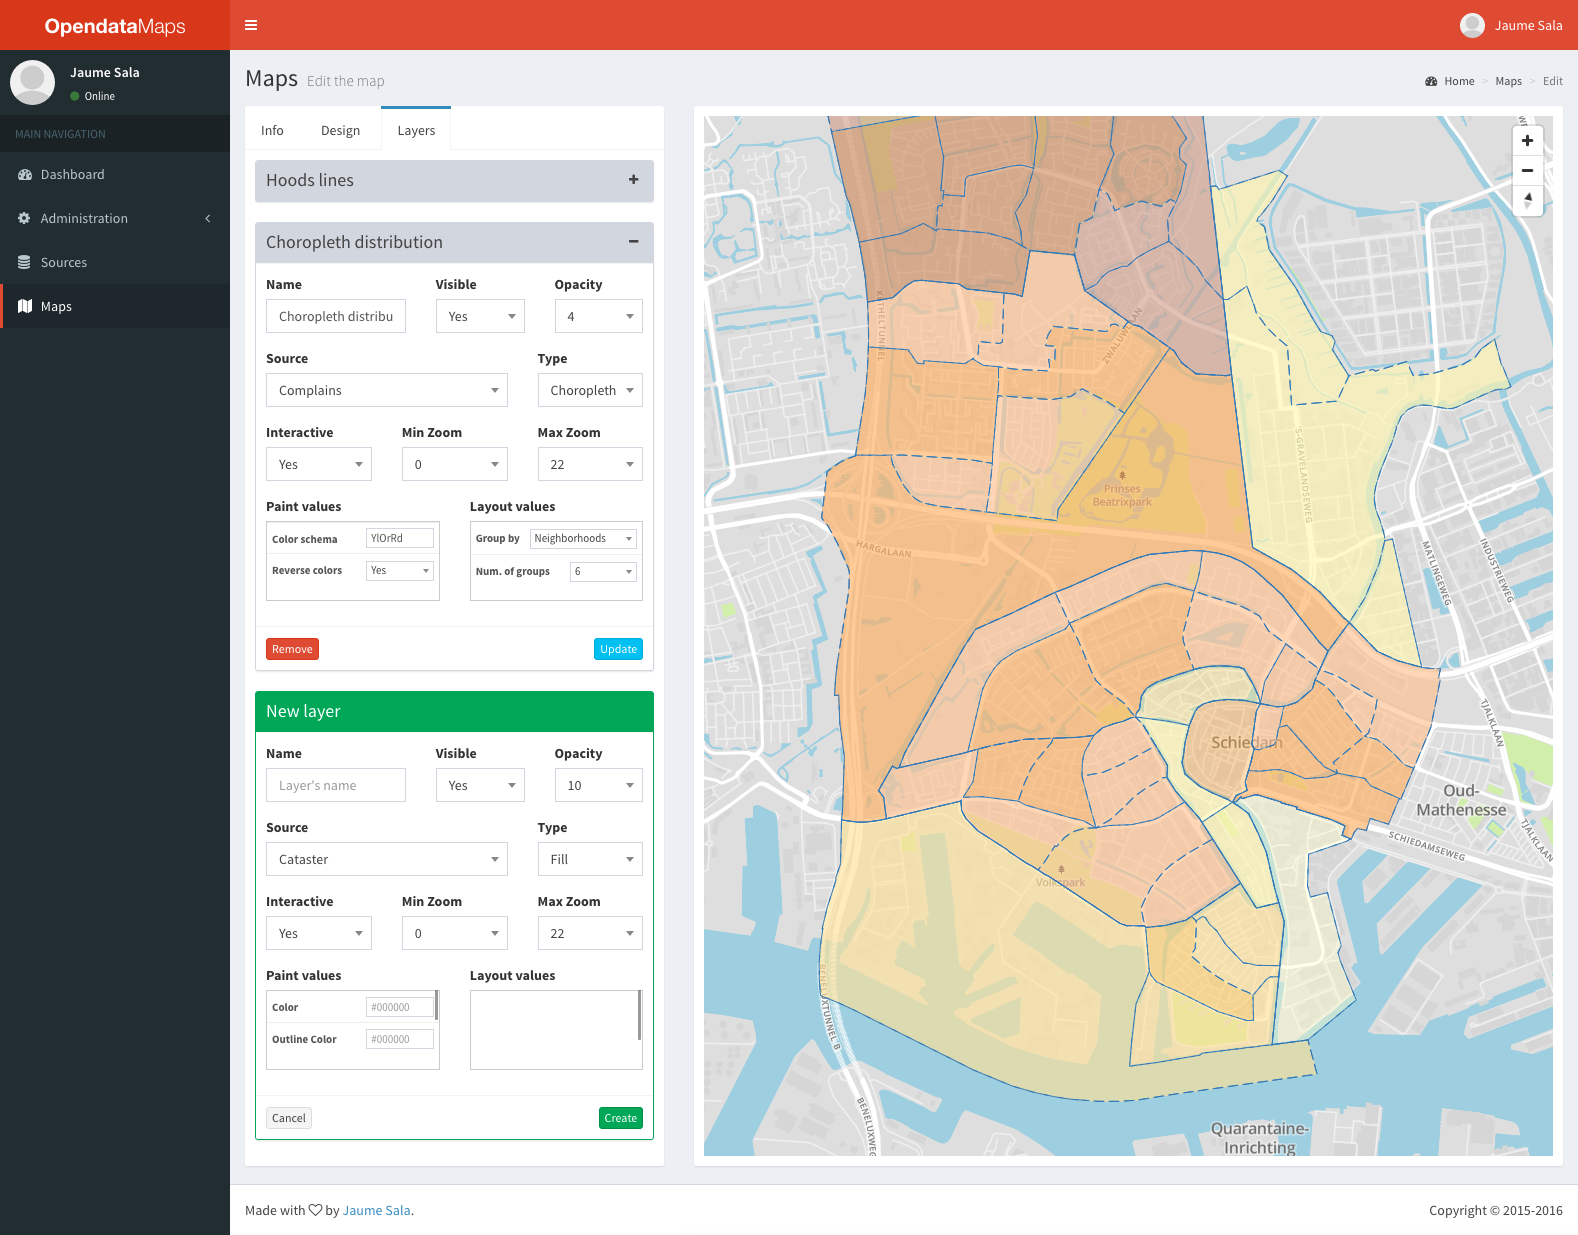
The tool connects with open data sources - datasets - and converts them into spatial information, such as choropleths, heatmaps, or other type of maps. The idea behind this concept is to remove the technological barriers that the citizens have while trying to understand open data, using shapes and colors instead of spreadsheets or raw data, for instance.
Take a look at the source code: github.com/jaumesala/opendata-maps